Measuring OSS Performance With Operational KPIs
Track KPIs across all five layers to catch revenue leaks and churn signals early.

Telecom operators track hundreds of data points across OSS, BSS, CRM, billing, and customer care systems. Volume was never the problem. Most KPI programs cover one or two categories, almost always network uptime, and miss the early signals that predict churn, revenue decline, and service failure long before any of it shows up on a balance sheet or a customer satisfaction survey. A KPI read on its own tells you what happened. A KPI read against the full provisioning-to-activation chain tells you why it happened and exactly where in the chain things came apart. That distinction is the subject of this piece: which KPIs actually expose whether an operator's workflows, data, and service delivery lifecycle function as one system, rather than as five departments that happen to share a logo.
The five categories OSS KPIs fall into
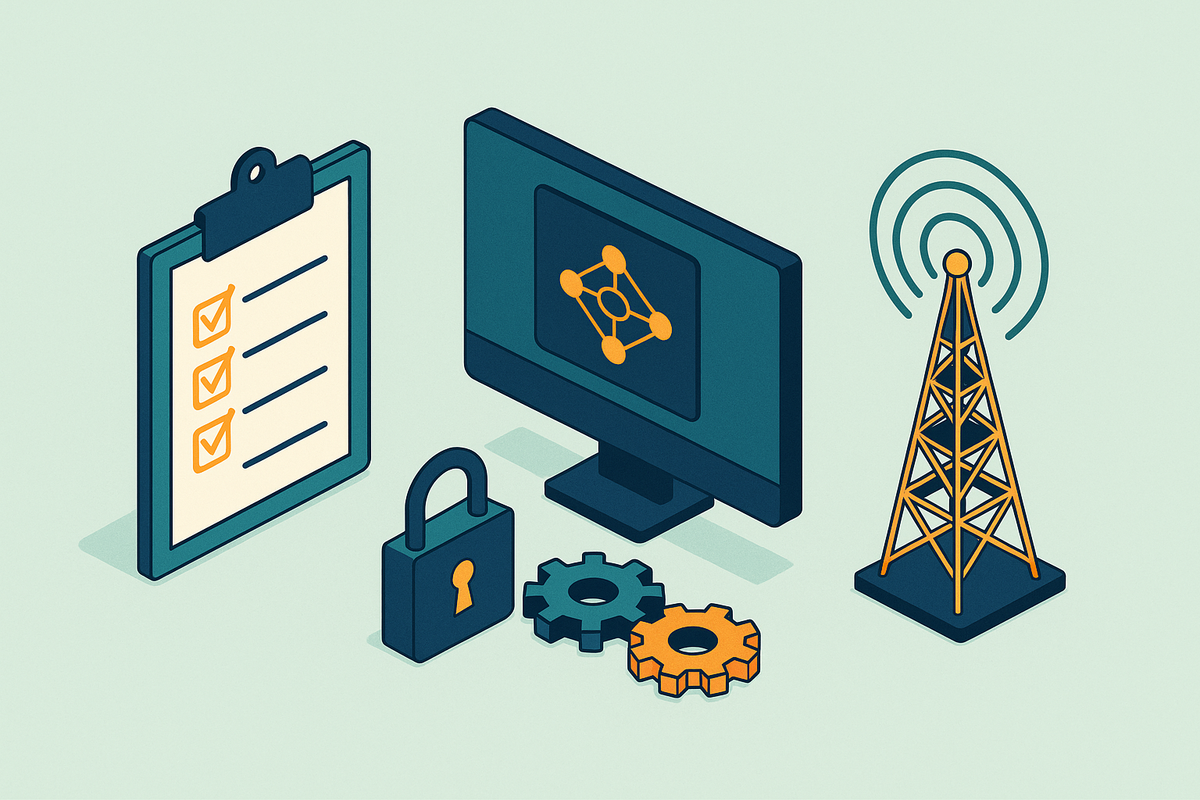
Telecom KPIs sort into five categories: network performance, operations, compliance, finance, and customer experience. Each measures a different layer of the business, and each layer depends on the ones below it.
Network performance covers availability, latency, jitter, packet loss, and circuit utilization: the raw signal quality of the infrastructure itself. Operations covers mean time to detect (MTTD), mean time to repair (MTTR), provisioning cycle times, and order fallout rates: the speed and reliability of the workflow layer. Compliance covers SLA adherence, regulatory obligations, and audit trail integrity, the paper trail proving the other layers did what they claim. Finance covers cost per user, average revenue per user (ARPU), and revenue leakage. Customer experience covers activation lead times, fault resolution times, and service quality scores, the layer the subscriber actually feels.
Most operators weight their dashboards almost entirely toward the network layer, because that data is the easiest to collect and has the oldest systems built around it. The other four categories get underweighted, or measured inconsistently from one system to the next, causing an operator to end up staring at a green network dashboard while the business underneath it slowly rots. That's a structural blind spot, and it's the one this piece keeps coming back to. It's a structural blind spot, and it's the one this piece keeps coming back to.
Network performance KPIs and what degradation signals about OSS health
Network availability measures the percentage of time a service is actually reachable. Latency measures the delay in getting a packet from one point to another. Jitter measures how much that delay varies, which matters enormously for voice and video. Packet loss measures how much data never arrives. Every network operations center already watches these four.
The two metrics that say the most about OSS health specifically are MTTD and MTTR. A high MTTD means fault detection runs slow, and that almost always traces back to a monitoring stack that isn't properly wired into the OSS, so alerts sit in one system while the record of truth sits in another. A high MTTR points to something worse: a broken resolution workflow, where ticketing, dispatch, and network systems each hold a partial picture and none of them talk to each other in real time.
Circuit utilization tells a quieter story. Chronic under-utilization or over-utilization usually has nothing to do with the network itself. It points to capacity planning data inside the OSS that's stale or wrong. A circuit that looks maxed out on paper but isn't in reality, or the reverse, means someone built a provisioning decision on bad information.
SLA compliance is the number that ties all of this together, because it only holds up if every upstream KPI and every workflow behind it actually works. Watch for the pattern where network KPIs look fine in aggregate, availability's good, latency's good, but SLA compliance keeps slipping anyway. That combination is the signature of a data integrity problem inside the OSS, not a network failure. The network runs fine. The record of the network does not.
Operations KPIs: provisioning cycle time, order fallout, and where service delivery breaks down
Provisioning cycle time measures the elapsed time from order acceptance to service activation, and it's one of the most direct readouts of OSS workflow health there is. Order fallout rate measures the percentage of orders that stall or fail mid-process and need someone to step in by hand. High fallout is rarely a one-off glitch. It's a symptom of data gaps or broken handoffs between systems that were never built to talk to each other.
Zero-touch provisioning is the benchmark, and reaching it consistently remains a significant challenge across the industry. A technician installs an optical network terminal (ONT) at the customer premises, and the system should handle everything downstream automatically, all without a single manual back-office step. Anywhere that chain requires a person to re-key data or reconcile records by hand is a point of failure waiting to happen.
Time-to-invoice is the operations KPI worth opening with, because it's the one that exposes everything else. Operators running unified order-to-cash platforms report meaningful time-to-invoice improvements. Those gains reflect more than provisioning speed on their own. They're a proxy for whether field execution data, photos, GPS coordinates, test results, flows straight into billing without a reconciliation lag sitting in the middle.
Manual handoffs between OSS and BSS are where revenue actually leaks and where customer experience problems start, which makes OSS/BSS seam quality an operations KPI in its own right, not a footnote to one. For FTTH and fiber operators specifically, the activation completion event should trigger billing directly. When someone has to manually confirm activation before an invoice can generate, provisioning cycle time and time-to-invoice start to diverge. That gap is measurable revenue leakage, sitting in plain sight on two reports that nobody bothered to compare.
Financial and compliance KPIs and the cost of fragmented data
ARPU, average revenue per active subscriber measured monthly or annually, is the most-watched financial KPI in the industry, and its typical value swings widely depending on market and service mix. Rising ARPU usually signals successful bundling or real pricing power. Falling ARPU usually signals competitive pressure, or subscribers trading down to cheaper tiers. Either way, ARPU alone flags that something changed without explaining the cause. It just flags that something changed.
Fragmented OSS data is what turns that ambiguity into actual revenue leakage: provisioning records, billing records, and network records drift out of sync until nobody can say with confidence what a customer is actually being billed for versus what they're actually receiving. Cost per user follows the same pattern. It means almost nothing until it can be broken down by workflow, by service type, by which specific activation step is driving the cost, and that breakdown only works with a data model every relevant system shares.
SLA compliance belongs on the compliance side of the ledger too, not just the network side. In a regulated environment, SLA records are audit evidence. A gap in that trail isn't a mild inconvenience, it's compliance exposure with real consequences. Telecom sits among the most heavily regulated industries there is, and any AI system touching customer proprietary network information (CPNI), billing records, or provisioning data inherits every one of the operator's existing compliance obligations. A serious KPI framework has to track auditability alongside operations, not instead of it.
A provisioning delay can rarely be traced to a specific dollar figure of revenue impact, because the data describing the delay and the data describing the revenue live in separate systems that were never built to reference each other. That's the cost of fragmentation, made visible the moment someone actually tries to connect the two.
Why customer experience KPIs lag everything else
Activation lead times, fault resolution times, service quality scores: these are the KPIs that reflect OSS problems last and hit churn first. Well-run operators keep monthly churn below 1.5%. On a base of 500,000 subscribers, cutting churn by even one percentage point means retaining roughly 5,000 customers a month, and each retained subscriber saves somewhere in the range of $200 to $600 compared to acquiring a new one to replace them.
That figure is the real payoff for catching CX problems early. It puts a dollar value on what upstream OSS monitoring is actually worth.
Timing is the trouble. By the time churn starts climbing, the OSS workflow failures that caused the bad experience already happened weeks or months earlier, buried under everything since. Customer experience KPIs report on damage already done, by nature. Provisioning cycle time creeping upward, order fallout ticking higher, time-to-invoice gaps widening: all of it is visible in the operations layer well before a customer ever picks up the phone to complain.
A KPI program that measures CX outcomes and stops there is measuring the cost of failures that already happened, which is nearly useless as a management tool. Building the framework so CX numbers trace back to their operational and network-layer causes is the only way to catch the problem while it's still cheap to fix.
Why fragmented data sources make any KPI program unreliable
Most telecom companies pull KPI data from network OSS and network management systems (NMS), CRM, billing and BSS platforms, and contact center tools, with no shared data model tying any of it together. The predictable result: the same KPI, provisioning cycle time, say, gets defined slightly differently in each system, and the numbers disagree. Teams end up arguing about whose report is right instead of acting on what the numbers are trying to say.
That's an architecture problem, not a reporting problem. KPI inconsistency is a symptom of siloed workflows, not bad dashboard design, and no visualization software fixes a disagreement baked into the underlying data.
Omdia's 2026 report on OSS architecture makes the point directly: legacy OSS systems were never designed for AI-driven operations, and the result is data that's fragmented, siloed, and hard to reach even when it technically exists. The fragmentation that blocks AI adoption is the same fragmentation that blocks reliable KPI measurement. It's one gap wearing two different names.
Deloitte's State of AI in the Enterprise research found that only one in five companies has a mature model for governing autonomous AI agents. That governance gap and the data fragmentation gap describe the same structural weakness from two different angles. Without one unified data model, there's no such thing as an authoritative KPI, only a set of numbers, each carrying a silent asterisk about which system produced it and whether the system next door would agree.
What a unified data model changes about KPI measurement
The fix, at the architectural level, is a data platform that ingests every source, applies one consistent definition for each KPI at the platform layer, and surfaces the results on a single governed dashboard nobody has to reconcile by hand afterward.
Research on the prerequisites for agentic AI backs this up directly: unified access to network, operational, and business data through one shared data model is what makes AI-generated insight accurate and complete. Without that unification, AI-generated insight comes out fragmented or flat-out misleading, because it inherits whatever inconsistencies were already sitting in the source systems.
TM Forum's Open Digital Architecture and its Information Framework (SID, formerly the Shared Information/Data Model) exist to solve exactly this at an industry level. Adopting them cuts vendor lock-in, simplifies data exchange between systems that were never built by the same company, and lets AI and analytics tools operate across a genuinely mixed environment instead of just one vendor's corner of it.
What unification actually buys a KPI program is specific. A single provisioning cycle time figure stays consistent whether it's viewed from OSS, BSS, or the billing system. Order fallout traces back to the exact workflow step that caused it, instead of landing in a log as a generic failure. Time-to-invoice runs on the same clock as service activation rather than getting reconciled after the fact by someone comparing two spreadsheets. SLA compliance gets checked against one shared audit trail instead of reconstructed from whatever system logs happen to still exist.
The qualification-to-activation chain is the spine holding all of this together: every KPI in the provisioning lifecycle should trace back to one authoritative record that moves through qualification, design, provisioning, and activation without getting handed off between separate data stores along the way. For fiber, dedicated internet access, and Carrier Ethernet operators, this is a specific requirement for services where the activation event has to trigger billing automatically and where network resource records need to be accurate at the moment of design, not patched up later. It's a specific requirement for services where the activation event has to trigger billing automatically and where network resource records need to be accurate at the moment of design, not patched up weeks later.
What AI changes about detecting OSS KPIs and when
Industry signals point to 2025 and 2026 as the period when autonomous networks moved from pilot projects to operational priorities. That shift is why AI's role in KPI monitoring is a production question now, not a research one.
AI agents already operating in network environments can spot congestion patterns, radio access network (RAN) parameter anomalies, and fault signals that precede an outage, and these leading indicators appear before MTTD even gets triggered. That's the real shift AI enables, moving from measuring a KPI after a threshold gets breached to catching the pattern that precedes the breach. Predictive maintenance shifts from something that kicks in once things have already gone wrong to a standing monitoring posture, because AI can catch the pattern before it escalates.
The same logic applies to provisioning. Agents handling order fallout and workflow execution can flag the cause of a stalled order the moment it happens, instead of letting it appear quietly in a report the next morning after the damage is done.
None of this works without guardrails, and Ericsson's white paper on agentic AI governance is direct about what those guardrails need to look like: agents have to operate inside secure, auditable sandboxes, and every inference or recommendation an agent makes needs to trace back to the agent's version, its input context, and the logic behind the decision. In practice, deployments stay deliberately conservative. Agents can detect a fault and trigger a basic remediation step, but anything higher stakes, changing live network parameters, touching billing-sensitive operations, still needs a human to sign off.
None of this replaces the KPI framework itself. What it does is make operations-layer and network-layer leading indicators actionable before they cascade downstream into the customer experience and financial metrics that only ever show the damage after it's spread.
Building a KPI measurement framework that covers the full provisioning-to-activation chain
A working framework has to span all five categories and stay traceable across the entire lifecycle, qualification, design, provisioning, activation, billing, instead of living siloed inside whichever system happens to own each piece.
Network performance forms layer one: availability, latency, MTTD, MTTR, SLA compliance, measured continuously, with AI-assisted anomaly detection catching the leading signal before any threshold actually gets crossed. Layer two is operations: provisioning cycle time, order fallout rate, zero-touch activation rate, time-to-invoice, the core workflow numbers that expose how good or bad the OSS/BSS seam really is. Layer three is financial: ARPU trend, cost per user broken down by service type and workflow step, revenue leakage rate, none of which mean much unless provisioning and billing data already share one model. Layer four is compliance and audit: SLA audit trail completeness, AI action traceability, adherence to governance policy, non-negotiable in any regulated market, proving the system is accountable rather than merely efficient. Layer five is customer experience: activation lead time, fault resolution time, churn rate, treated as trailing validation of everything above it, not as the main number anyone should measure first.
When a CX or financial KPI moves in the wrong direction, the investigation has to start at the operations and network layers every time, never at the customer-facing number itself. Built this way, the cause becomes visible before the symptom has a chance to escalate into churn or lost revenue.
Governance deserves its own place in this list, not a mention in passing. Audit trail completeness, the rate at which high-stakes automated actions actually get human approval, agent action traceability: these aren't optional additions bolted onto a framework that already works. They're what makes the framework trustworthy at all in an environment where AI agents are making some of the calls.
An AI-native OSS is a system where AI agents work off the same APIs, the same audit logs, and the same permissions as the human operators sitting next to them, forming the architectural floor beneath all five layers. Without it, none of the five layers can be measured consistently, and the causal chain from a network event all the way to customer impact never becomes visible end to end.
Sources
- The Future of Telecom OSS/BSS Is Not More AI Agents — It Is Negotiated Systems Architecture | by Nitin Gupta | Active Minds Hub | Medium
- Agentic AI for autonomous telecom networks - Ericsson
- Telecom KPIs: The Complete Guide to Network, Subscriber and Revenue Metrics (2026) | Infoveave
- 23 Critical Telecom KPIs That Measure Growth | NetSuite
- sequentialtech.com
- vc4.com