OSS KPI Benchmarks for Fiber and Carrier Ethernet Operators
Five OSS categories reveal where fiber operators actually lose business, not just network health.
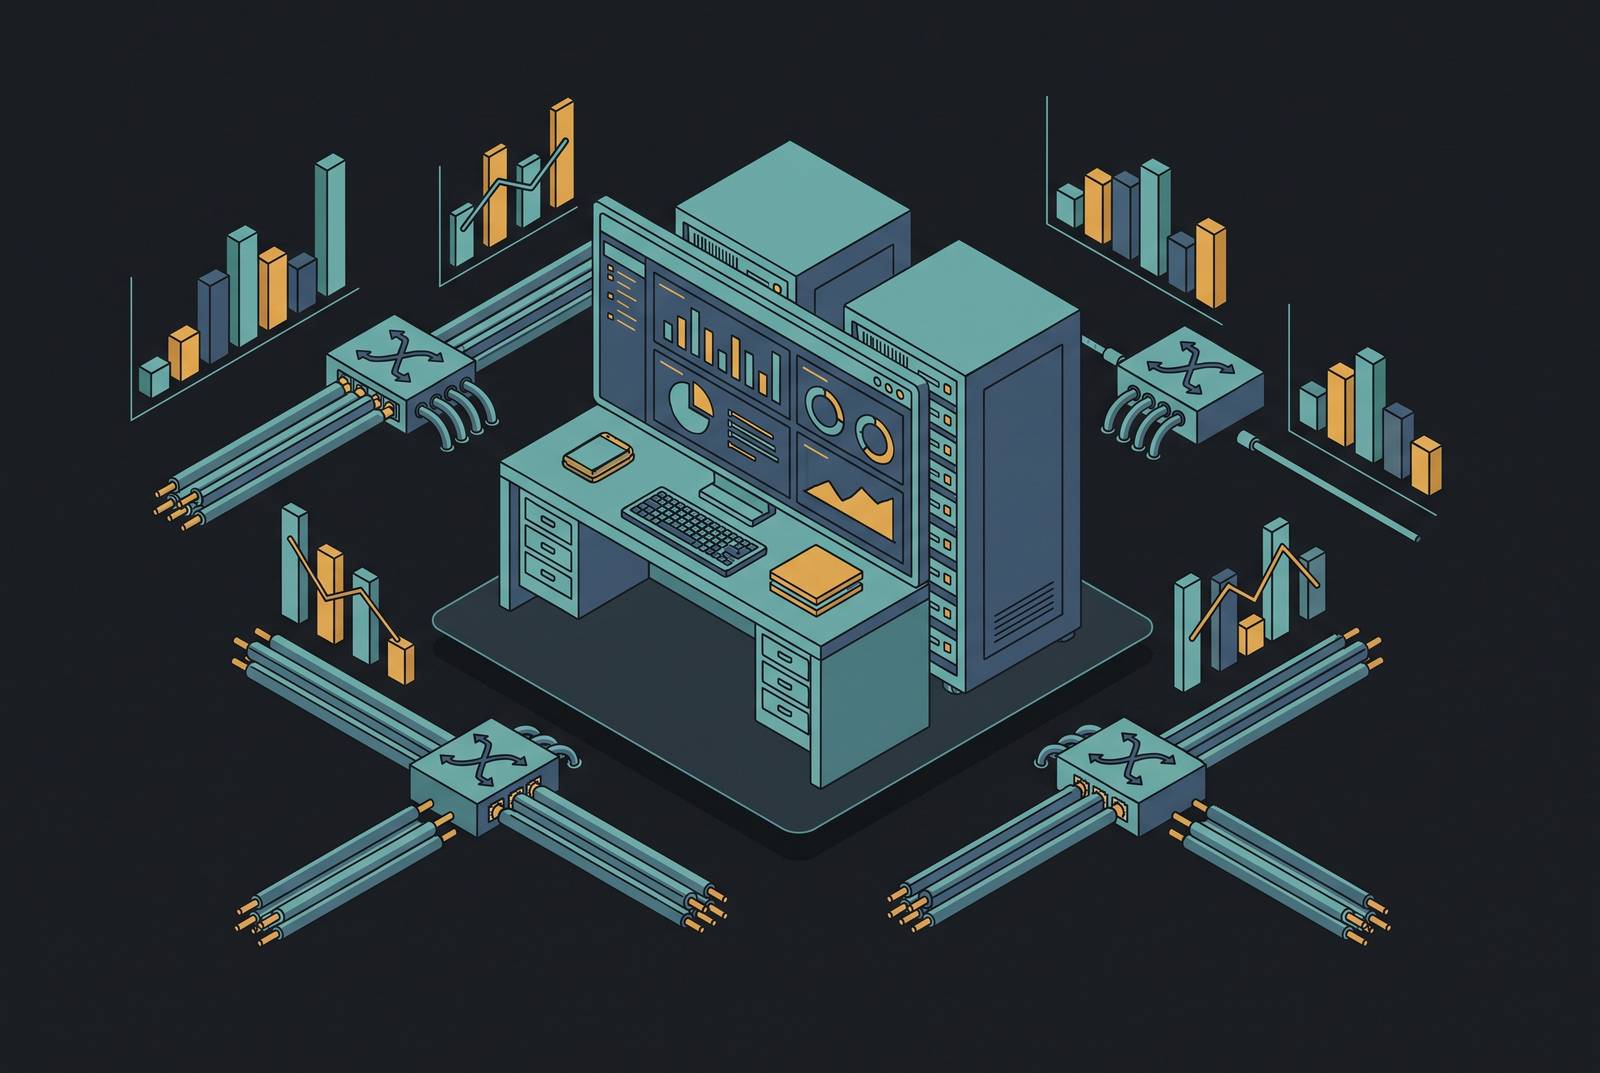
Most fiber and Carrier Ethernet operators are measuring the wrong layer of their own business. At almost any broadband provider, a Monday morning operations meeting runs on instinct rather than evidence: a sense that a particular region is losing subscribers, a feeling that billing has slowed down this quarter, a shared impression that installs went badly last month. That pattern doesn't mean the metrics don't exist; it means the dashboard everyone is staring at, green across the board, is answering a question nobody asked, while the business underneath it quietly loses ground. Network availability, latency, jitter, and packet loss dominate OSS dashboards because they are the easiest data to collect and because decades of tooling were built to collect them, not because they're the metrics that explain why orders stall or why invoices lag behind activation.
OSS KPIs actually sort into five categories: network performance, operations, compliance, finance, and customer experience. Network performance sits at the foundation, but it doesn't follow that performance is what the business should optimize for in isolation, since it answers a narrower question than the one the business actually needs answered.
Every section that follows draws a distinction between what a KPI tells you and what it diagnoses. A metric read in isolation reports an outcome: MTTR was four hours, a substantial share of orders fell out, time-to-invoice was nine days. Read against the full provisioning-to-activation chain, the same number becomes a diagnostic: it shows where in the chain the breakdown happened and which systems failed to talk to each other when it mattered. That shift, from outcome to diagnosis, is what separates an OSS dashboard that looks reassuring from one that actually tells an operator where to intervene.
What MTTD and MTTR diagnose about workflow architecture
Mean time to detect and mean time to repair are the two operations KPIs that most directly reveal whether an OSS functions as a single coordinated system or as a loose collection of tools stitched together with manual workarounds. MTTD measures the average time elapsed between when a fault occurs and when it's detected, and a long MTTD is a data-integration problem before it's a monitoring problem: it means the systems capable of seeing the fault aren't the systems watching for it, or the two aren't sharing information fast enough to matter.
MTTR carries a parallel diagnosis on the resolution side. Each delay compounds the next, and the total resolution time reported on a dashboard becomes an average of every handoff friction in the chain, not a measure of how hard the underlying fault was to fix.
End-to-end visibility is what makes the shift from reactive to proactive service assurance possible, and without it, MTTD and MTTR measure symptoms of an architecture problem that better alerting alone cannot fix. An operator can add more monitoring points, tune alert thresholds, and staff a bigger operations team, and still watch MTTR stay flat, because the bottleneck was never detection sensitivity. It was the absence of a shared, real-time record that ticketing, dispatch, and network operations could all read from and write to at the same time. These two metrics exist to answer one architectural question: does information move through this organization as fast as the network itself does, or does it move at the speed of the slowest manual handoff between systems.
Circuit utilization and SLA compliance as data integrity tests
Circuit utilization and SLA compliance get filed under network performance on most dashboards, but when either one drifts from operational reality, or from each other, the fault almost always sits inside the OSS data. Circuit utilization tells a quieter story than an outage does. Somewhere upstream, a provisioning decision got built on information that no longer matched the network it described.
SLA compliance produces a more specific warning pattern that is worth recognizing on sight. And yet SLA compliance keeps slipping anyway, quarter over quarter, without a corresponding dip in the raw network numbers. That combination, clean network metrics paired with eroding SLA performance, is the signature of a data integrity problem inside the OSS. The records describing what it was asked to do, and what it actually delivered against a specific contract, have drifted apart.
The stakes around SLA compliance are highest where enterprise accounts are being actively contested. Competitive movement at this level means enterprise accounts are shifting between providers actively enough that SLA compliance can't be treated as a reporting formality. A Carrier Ethernet provider whose SLA numbers quietly slip while its network dashboard stays green is handing competitive ground to rivals who can prove consistent delivery against contracted terms, in a market where the leaderboard itself shows share is actively changing hands.
Provisioning cycle time and order fallout as the clearest readout of OSS workflow health
Provisioning cycle time and order fallout rate are the two operations metrics that most directly show whether an OSS workflow behaves as one coordinated system. Provisioning cycle time is the elapsed time from order acceptance to service activation, and it functions as a direct readout of how many separate systems a single service order has to pass through before it completes. A long cycle time is evidence that the order moved through multiple handoffs, each one requiring a person to reconcile data that the systems themselves couldn't pass along automatically.
Order fallout rate, the percentage of orders that stall or fail mid-process and require manual intervention to push through, tells a related but distinct part of the story. High fallout is rarely a one-off glitch affecting a handful of unlucky orders. It's a symptom of data gaps or broken handoffs between systems that were never designed to communicate, and it recurs at a predictable rate until the underlying architecture changes.
Zero-touch provisioning sets the benchmark against which both metrics should be read. One African operator cut the time to sign a new contract from a week down to 10 minutes after adopting a hyperscaler and microservices architecture, a result that illustrates what becomes possible once manual re-keying is removed from the provisioning chain.
For FTTH operators specifically, provisioning cycle time carries a second dimension that makes it worth tracking even more closely: install interval connects directly to early churn. Provisioning cycle time functions simultaneously as an operations KPI, measuring workflow efficiency, and as a retention KPI, measuring how many of the subscribers an operator just signed will still be customers in three months.
Time-to-invoice as the KPI that exposes the OSS/BSS seam
Time-to-invoice is the single operations metric that exposes the condition of everything upstream of it, because the gap between activation completion and invoice generation is a direct measurement of whether OSS and BSS share one data model or depend on a person to reconcile two separate records. For FTTH and fiber operators, the activation completion event should trigger billing directly, with no manual step standing between a service going live and a bill going out. When someone has to manually confirm activation before an invoice can generate, provisioning cycle time and time-to-invoice diverge into a measurable revenue gap, one that widens for as long as the manual confirmation step remains part of the process.
Manual handoffs between OSS and BSS are where revenue leaks out and where customer experience problems originate, which makes the quality of that OSS/BSS seam an operations KPI in its own right, not a footnote to the systems on either side of it. Operators running unified order-to-cash platforms report meaningful improvements in time-to-invoice that reflect more than faster provisioning. They function as a proxy for whether field execution data, photos, GPS coordinates, test results captured at the moment of installation, flows straight into billing without sitting in a reconciliation queue first.
Carrier Ethernet carries the same logic down to the level of individual service attributes. The mismatch doesn't announce itself. It sits quietly between a provisioning record and a billing record until someone goes looking for why margin on that account doesn't match the contract terms.
Time-to-invoice divergence is an architecture problem, a direct signal that the systems recording what the network did and the systems billing for what the network did aren't reading from the same record.
Why a unified data model is the structural answer
Every KPI failure described so far, high order fallout, slow MTTR, a widening time-to-invoice gap, traces back to the same root cause. Multiple systems each hold a partial, asynchronous version of the same service record, and people spend their time bridging the gaps between those versions by hand. The fix for that condition is a change in how the underlying data is modeled and shared.
The structural requirement is that every KPI in the provisioning lifecycle should trace back to one authoritative record, a single source of truth that moves through qualification, design, provisioning, and activation without being handed off between separate data stores along the way. For fiber, dedicated internet, and Carrier Ethernet operators, that requirement is specific rather than generic: the activation event has to trigger billing automatically, and network resource records have to be accurate at the moment of design, not patched up after the fact once a discrepancy surfaces downstream.
Legacy OSS architectures weren't built with this requirement in mind. Layering AI, analytics, or automation on top of that fragmentation leaves the new tools to inherit the same blind spots the old ones had, because the underlying records were never reconciled.
Operators often assume a unified data model is only worth pursuing after completing a large-scale modernization project, something to tackle once the legacy environment is cleaned up. The legacy complexity that makes transformation feel daunting is the same complexity in which a unified model can start delivering value first, beginning with whichever service types are generating the highest order fallout today. The service lines causing the most operational pain are also the ones where a unified record produces the fastest, most visible improvement.
Finance and retention KPIs that the provisioning chain directly controls
ARPU, churn rate, and customer lifetime value are the financial outcomes that OSS workflow failures ultimately produce. They read as lagging indicators, business results that appear in finance reports weeks or months after the operational failures that caused them are already visible in MTTR, order fallout, or time-to-invoice. By the time a finance team notices churn ticking upward, the provisioning failures responsible for it happened a billing cycle or two earlier.
ARPU for U.S. fiber broadband consumers generally falls in the $65 to $75 per month range, and managed services and add-ons can each contribute meaningfully to that figure. An add-on sold but never reflected cleanly in the billing record doesn't raise ARPU. It raises a support ticket.
Early churn links back to provisioning with similar directness. Each of those is an OSS failure first, one that the churn number eventually reports after the fact, often long after the operational team that could have caught it has moved on to the next order.
The CLV to CAC ratio gives that chain a concrete test. A provider can hold acquisition volume steady while losing ground on this ratio if provisioning failures keep pushing early disconnects up.
First Contact Resolution and transfer and escalation rates round out the picture from the customer experience side, predicting churn before it ever appears in the retention numbers. Both depend on support agents having unified access to billing, CRM, and network status in one place. An agent fielding a call without visibility into whether a service was actually activated correctly cannot resolve that call on first contact, and the transfer that follows is itself a symptom of the same fragmented data model appearing at the point of customer contact.
Governed AI automation as a KPI multiplier, not a separate initiative
AI-driven automation can compress MTTR, reduce order fallout, and close the time-to-invoice gap described throughout this piece, but only under one condition: AI agents have to operate on the same APIs, audit trails, and permission structures as human operators, so their actions are traceable inside the same KPI framework already in place. Automation layered on top of a fragmented data model doesn't fix the fragmentation. It executes against it faster.
The governance challenge here is specific. An AI agent chaining tool calls across provisioning, billing, customer records, and network management satisfies none of the regulatory assumptions built for a human-operated system. The action surface has moved from a screen a person reads and approves to a tool call that fires in milliseconds, with no human pause built into the sequence unless one is deliberately engineered back in.
A risk-weighted governance structure gives operators a practical way to reintroduce that pause where it matters. Every action across all three tiers produces an auditable line from decision to outcome, so the trail itself can be inspected after the fact.
Ungoverned AI automation introduces its own new class of KPI failure. An agent that fires a provisioning action outside the audit trail doesn't register in order fallout rate until the error becomes visible downstream, often well after the action itself occurred. That delay makes the audit trail a KPI in its own right, a measure of whether AI governance is functioning as designed, running parallel to every metric described in this piece. The KPI framework that exposes fragmented OSS workflows today is the same framework that will expose ungoverned automation tomorrow, if operators extend it to cover the agents now acting inside it.